Jul 21st, 2026
Compare Curtis Linton to Jason Hoover
Compare Jason Hoover and Curtis Linton using campaign finance reports, public comments, and county records. Review the evidence before you vote.
For years, conversations about growth, taxes, infrastructure, and affordability in New Castle County have circled the same frustrations. Costs rise faster than revenues. Roads, pipes, and public services strain under maintenance backlogs. Housing becomes harder for young people to afford. New development is often blamed, even as the county continues to grow.
This article takes a step back from opinion and looks at the numbers beneath the debate .
Specifically: What does New Castle County’s zoning map actually allow us to build, and what does that imply for long-term fiscal health?
This is not a moral argument or a design critique. It is an attempt to measure how much land is legally reserved for different development patterns, and how those patterns tend to perform fiscally over time.
The conclusion is difficult to avoid: one of the biggest barriers to building smarter is simply making it legal to do so.
Using publicly available zoning data from New Castle County’s GIS system, we calculated the total acreage assigned to each zoning category. Each zoning district was then grouped based on well-established fiscal performance patterns observed across the U.S.:
This approach is commonly used in municipal finance analysis. It does not calculate parcel-level profits or losses, and it does not assume every project behaves identically. Instead, it evaluates patterns , not individual outcomes.
There is some unavoidable judgment involved in grouping districts. Boundaries between categories are not perfectly sharp, and small classification changes can move acreage slightly between groups. For that reason, this article focuses on orders of magnitude and proportions , not precise acre counts carried out to the last digit.
The results are consistent across reasonable interpretations.
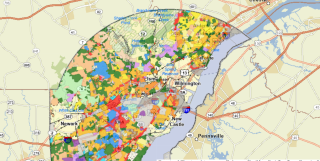
Caption: NCC is freckled with different types of zoning categories. Each zoning category holds a different economic potential.
For the purposes of this analysis, residential zoning districts were grouped into three broad fiscal categories.
These districts are compact enough that, on average, they generate more public revenue per acre than they cost to serve over time. They use infrastructure efficiently and tend to stabilize municipal budgets.
This category includes:
These districts often appear reasonable and familiar, but frequently struggle to fully cover long-term infrastructure and service costs unless conditions are ideal.
They can function in the short term, but tend to accumulate maintenance liabilities over decades.
This category includes:
These districts are consistently associated with high public costs and low revenue per acre. Over time, they rely on subsidy from more productive areas.
This category includes:
These labels describe financial performance , not neighborhood quality or intent.
When residential zoning acreage is grouped this way, a clear pattern emerges.
Depending on how borderline categories are treated, the exact percentages shift modestly. But across all reasonable interpretations:
These proportions matter far more than the exact numbers.
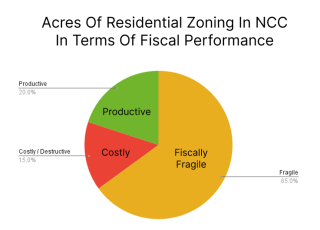
Caption: In New Castle County, only a small share of residential zoning reliably pays for itself, most of it sits in a fiscally fragile middle, and a meaningful portion is structurally subsidized by the rest.
It is tempting to focus on the most extreme cases, such as very large-lot zoning. But the most consequential finding is not at the edges. It is in the middle.
Fiscally fragile zoning:
Because it does not fail immediately, it accumulates deferred costs that only surface years later, when infrastructure must be repaired or replaced. This is how jurisdictions grow while still feeling financially constrained.
In New Castle County, this fragile middle dominates the residential zoning map .
Commercial and industrial zoning does generate higher revenue per acre, but it occupies a relatively small share of the county’s land and cannot realistically subsidize an inefficient residential base on its own. That limitation has long been masked by the presence of a few major economic pillars that generated outsized tax revenue and employment.
For decades, New Castle County benefited from large corporate anchors and industrial employers, including companies like DuPont, AstraZeneca, and the Chrysler assembly plant. These employers helped offset the fiscal weaknesses embedded in much of the county’s residential zoning by contributing substantial commercial tax revenue relative to their land footprint.
That era is ending.
Several of these historic economic pillars have downsized, relocated, or exited entirely. At the same time, temporary supports that helped stabilize local budgets in recent years are disappearing. Federal ARPA funds, which were relied upon to balance budgets and backfill structural gaps, are now gone. The county’s property reassessment, the first in roughly 40 years, exposed how much of the tax burden had quietly shifted onto residential property. For many residents, the result was a sudden and significant increase in tax bills.
These pressures are not theoretical. They are being felt in real time through:
What this moment reveals is not mismanagement in isolation, but a structural dependency. When non-residential land is expected to carry a fiscally fragile residential system, the loss of major employers or temporary funding immediately exposes the imbalance.
Healthy municipal finances depend on productive residential patterns working alongside employment and commercial uses , not compensating for their absence. When residential zoning is dominated by development forms that struggle to pay for themselves, even a strong commercial sector cannot provide lasting stability.
As those commercial anchors fade, the underlying math of the zoning map is no longer hidden.
These zoning patterns help explain several persistent issues:
When most land is reserved for development forms that are financially fragile or destructive, the system relies on a narrow slice of productive areas to carry the load.
That is not a market failure. It is a legal one.
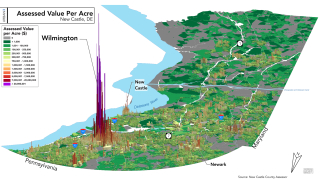
Caption: A small area generates the huge amounts of tax potential in New Castle County. Image attribution to The Urban3
This analysis does not claim that every compact project is good or every low-density neighborhood is bad. It does not argue for eliminating choice or forcing uniformity.
It shows something more basic.
If we want fiscally responsible development, we must first make it legal to build it.
Right now, New Castle County’s zoning map does the opposite. It makes productive development the exception and fragile development the norm.
No amount of incentives, planning documents, or rhetoric can overcome that imbalance.
Before asking how to build smarter, the county must confront a simpler question:
What does our zoning actually allow?
This article exists to answer that question with numbers rather than assumptions.


Candidate for New Castle County Council to bring economic sustainability through smart growth and open space preservation.
New Castle County, Delaware
Contact
(302) 265-4254
jason@gohoover.com